“A piping-hot pizza delivered straight to your door“. Aaahh, the modern convenience of last-mile delivery. You’re sitting on your sofa, ordering a pizza with just a few taps. <20 minutes later, that hot, cheesy goodness arrives at your door, like a carb-laden chariot of joy. Before you take that first blissful bite, let’s pull back the curtain on the true cost of your delivered pizza to your door. Spoiler: it’s more than just a delivery fee and a tip for the driver.
Please note: I’m not against pizza, far from it. You’ll see it’s a worthwhile analogy highlighting a problem-meet-feast of an issue to be aware of.
For consumers, last-mile delivery or the “delivery of everything” society we’ve created for ourselves has become a beacon of convenience. However, the rosy façade hides the inconvenient truth of last-mile delivery’s environmental inefficiencies. The pressure to mitigate supply chain impacts on the environment is mounting, yet the rapid growth of last-mile delivery has resulted in increased emissions and waste due to the influx of delivery vehicles on the road.
“Last Mile Delivery industry poised to grow from US$144 Billion in 2023 to US$276.36 Billion by 2031, growing at a CAGR of 8.5%”
This parade of environmentally inefficient vehicles operated by gig-workers and fleet operators alike is not the only culprit. The surging demand has led to more packaging waste, including an excess of boxes, bags, envelopes, protective stuffing, and take-out food containers, contributing to product damage.
Efforts are underway to mitigate these environmental drawbacks:
Shortening the Last Mile: Suppliers are adopting strategies to reduce adverse environmental effects, such as building micro-fulfilment centres (cloud kitchens) closer to consumers to shorten the distance between distribution centres and end consumers.
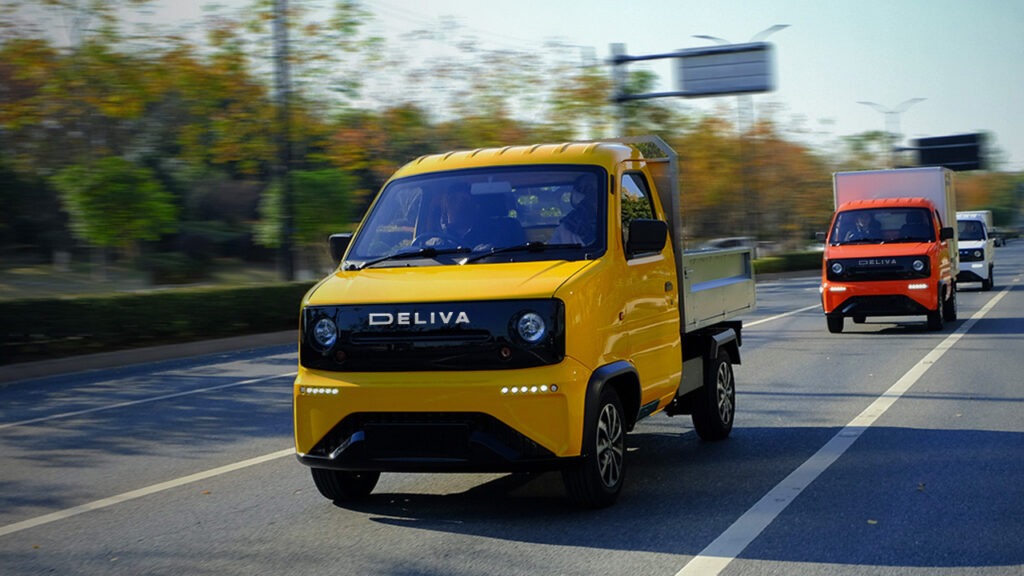
Greener Travel: Companies are experimenting with more environmentally friendly vehicles, like electric vehicles, to navigate the last mile. Although EVs require electricity, they significantly reduce emissions.
Optimised Routes: Employing route optimisation technology (telemetry) helps avoid unnecessary travel, making last-mile deliveries more efficient.
Reducing Packaging Waste: Retailers are making efforts to skip secondary packaging for products already in boxes, reducing packaging waste.
Allow me to break down and localise the cause and effects of the last mile in ecological terms:
Step 1: The Pizza’s Global Ingredient Adventure
You might think that a pizza is a simple thing: dough, sauce, cheese, maybe some toppings. But those humble ingredients have probably traveled farther than you have in the last two years.
Wheat for the Dough: Your pizza’s dough likely starts with wheat, which may have been grown in the plains of North America or Europe. That wheat then goes through a processing plant, gets milled, packed into sacks, and shipped halfway across the world, possibly by ship or freight truck, before it even reaches the pizza dough factory.
Tomatoes for the Sauce: While the sauce might be local, many pizza chains source tomatoes from far-off places like Italy or California, depending on where you live. Those tomatoes travel via truck, plane, and even cargo ships, leaving behind a decent-sized carbon footprint along the way.
Cheese (the MVP): Cheese, glorious cheese! Many mozzarella factories import dairy products globally, so even your cheese might have logged some miles before it melted on your pizza. Not to mention the cows that provided the milk likely chewed on some imported grains. Cow food miles? Yes, that’s a thing.
The true cost of pizza to the environment
Average gross weight of a large pizza 1kg
Calculations based on making 1,000 pizzas
Wheat for Dough:
Source: Various countries (e.g., United States, Canada, Australia, Russia)
Food miles: 7,800 miles
Transport: Typically shipped via cargo ships for long distances and supplemented by land transportation within the UAE or nearby countries.
Environmental impact: Carbon emissions from agriculture, transportation, and processing.
Pizza dough: Avg. weight 250g
CO2 Emissions USA to Dubai:
0.4 kg CO2 per ton-mile x 3,000 ton-miles ≈ 1,200 kg of CO2 or approximately 1.2 metric tonnes of CO2.
GHG Emissions = 1.2 metric tonnes of CO2 x 1.9 ≈ 2.28 metric tonnes of CO2 equivalent (CO2e) or approximately 2,280 kg of CO2e.
Tomatoes for Sauce:
Source: Italy, Spain, United States, China
Food miles: 3,700 miles
Transport: Shipped via cargo ships or air freight for longer distances. Some tomatoes may also be sourced locally or from nearby countries by road.
Environmental impact: Carbon emissions from agriculture, processing, and transportation.
Tomatoes: Avg. weight 400g
CO2 Emissions Spain to Dubai:
0.4 kg CO2 per ton-mile x 2,200 ton-miles ≈ 880 kg of CO2 or approximately 0.88 metric tonnes of CO2.
GHG Emissions = 0.88 metric tonnes of CO2 x 1.9 ≈ 1.672 metric tonnes of CO2 equivalent (CO2e) or approximately 1,672 kg of CO2e.
Cheese:
Source: Italy, United States, Australia
Food miles: 2,200 miles
Transport: Usually transported by refrigerated cargo ships or air freight for long distances. Local or nearby sources utilise road transport.
Environmental impact: Carbon emissions from dairy production, processing, and transportation
Cheese: Avg. weight 200g
CO2 Emissions Italy to Dubai:
0.4 kg CO2 per ton-mile x 1,100 ton-miles ≈ 440 kg of CO2 or approximately 0.44 metric tonnes of CO2.
GHG Emissions = 0.44 metric tonnes of CO2 x 1.9 ≈ 0.836 metric tonnes of CO2 equivalent (CO2e) or approximately 836 kg of CO2e.
Pepperoni or Meat:
Source: Various countries (e.g., United States, Italy, Spain, Brazil, Australia)
Food miles: 7,400 miles
Transport: Refrigerated cargo ships, air freight, and road transport for shorter distances within the region.
Environmental impact: Carbon emissions from livestock production, processing, and transportation.
Meat: Avg. weight 200g
CO2 Emissions Brazil to Dubai:
0.4 kg CO2 per ton-mile x 2,400 ton-miles ≈ 960 kg of CO2 or approximately 0.96 metric tonnes of CO2.
GHG Emissions = 0.96 metric tonnes of CO2 x 1.9 ≈ 1.824 metric tonnes of CO2 equivalent (CO2e) or approximately 1,824 kg of CO2e.
Olive Oil:
Source: Italy, Spain, Greece
Food miles: 2,200 miles
Transport: Typically shipped via cargo ships or air freight, depending on the distance and urgency. Land transportation is then used for shorter distances.
Environmental impact: Carbon emissions from oil production, processing, and transportation.
Olive Oil: Avg. weight 26g
CO2 Emissions Italy to Dubai:
0.4 kg CO2 per ton-mile x 14.3 ton-miles ≈ 5.72 kg of CO2 or approximately 0.00572 metric tonnes of CO2.
GHG Emissions = 0.00572 metric tonnes of CO2 x 1.9 ≈ 0.010868 metric tonnes of CO2 equivalent (CO2e) or approximately 10.868 kg of CO2e.
Vegetables:
Source: Various countries (e.g., Netherlands, Spain, China)
Travel distance: 3,100 miles
Transport: Often transported by a combination of road, rail, and sometimes sea or air freight, depending on the distance and urgency.
Environmental impact: Carbon emissions from agriculture, processing, and transportation.
Vegetables: Avg. weight 200g
CO2 Emissions Netherlands to Dubai:
0.4 kg CO2 per ton-mile x 1,100 ton-miles ≈ 440 kg of CO2 or approximately 0.44 metric tonnes of CO2.
GHG Emissions = 0.44 metric tonnes of CO2 x 1.9 ≈ 0.836 metric tonnes of CO2 equivalent (CO2e) or approximately 836 kg of CO2e.
The exact distances and environmental statistics would depend on the specific suppliers and supply chain used by a particular pizza restaurant in Dubai, which can vary widely. We wanted to use this example to conservatively and factually showcase the impact of the last-mile.
Step 2: The Cost of Production – More than Dough
Let’s say all your pizza’s ingredients have gathered at the local pizza joint. They didn’t teleport there, though. Oh no. Here’s a quick cost breakdown before the pizza even hits the oven:
Electricity & Gas: Pizza ovens don’t run on dreams; they guzzle gas or electricity. That high-temperature bake is as energy-hungry as you’re about to be when the pizza gets delivered. On average, it costs $1 to bake a single pizza, accounting for energy usage, according to some estimates. Doesn’t sound like much, but when you think of thousands of pizzas a day, that adds up quickly.
Labour Costs: Lest we forget the pizzaiolos – the noble pizza chefs who hand-toss your dough and artfully arrange those pepperoni slices like an edible mosaic. Labour costs for your pizza may be the single largest portion of the production cost, especially with increasing wages. You could be looking at $2–$3 per pizza just for the hands that make it.
Step 3: The Real Cost of Last-Mile Delivery
Now that your pizza is boxed and ready, we move into the most magical – and costly – part of the process: last-mile delivery. This is the home stretch, where getting the pizza from the restaurant to your door can get more expensive than the entire process of making it.
Fuel Costs: Your pizza delivery isn’t powered by good intentions alone; it’s powered by gasoline (or, if your delivery driver is eco-conscious, a few kilowatts of electricity). The cost of last-mile delivery is disproportionately high because the delivery route is the least efficient. Stop-and-go traffic, small delivery windows, and the fact that each order is individual mean you’re looking at anywhere from $1 to $5 in fuel costs alone.
Vehicle Wear & Tear: Every time your pizza guy hits a pothole, your order isn’t just shaken – there’s a real financial toll. Factor in vehicle maintenance, insurance, and depreciation, and the cost of delivery creeps up. Delivery services like; Grubhub, Zomato, Talabat, Wolt, Uber Eats charge you a nominal delivery fee, but they’re certainly paying more behind the scenes. Depending upon the market – riders’ owning their vehicles – these costs are borne by those ‘delivery heroes’.
Packaging: Oh, you thought that sturdy cardboard box your pizza came in was free? Think again. Packaging—especially if it’s eco-friendly – costs pizza chains millions annually. The grease-resistant lining, the fancy branding, and the structural integrity required to keep your pizza’s toppings in place – every detail adds to the environmental impact.
Step 4: Environmental Costs – The Invisible Toppings
While your pizza may be delicious, it leaves a trail of environmental impact in its wake. From the carbon emissions of transporting ingredients globally to the energy used in production and the fuel burned on delivery, your pizza has a larger carbon footprint than you’d expect. It’s estimated that each pizza’s carbon footprint is around 1.2 kg of CO2, but this number can jump dramatically depending on ingredient sourcing and delivery distance.
And let’s not forget food waste – about 13% of food ordered for delivery goes uneaten, destined to languish in the fridge before being thrown out. This contributes to methane emissions as the food rots in landfills. So that half-eaten pizza you forgot about in your fridge? It’s silently contributing to climate change, no big deal.
Headline Fact:
1,000 pizzas to arrive (from origin) to Dubai in their ingredient form by air.
Total CO2 emissions per 1,000 pizzas = 3.925 Metric tonnes or 2,967 kgs of CO2
Highlighting a standard 12-inch pizza can have a carbon footprint of 2.96 kg of CO2 emissions. This range accounts for different ingredients, production methods, transportation modes, and energy sources used for cooking.
Yet it’s the last mile where the impact hits home:
The average motorcycle produces 4.6 tonnes of CO2 each year.
Based on 60,000kms per year travelled.
We calculated an average based on customer data.
But what does that look like with annual consumption:
UAE pizza consumption 415,200 per year (globaldata.com)
Norway – the highest consumers of pizza globally – population 5.5m averaging 5 pizzas per year = 22m pizzas
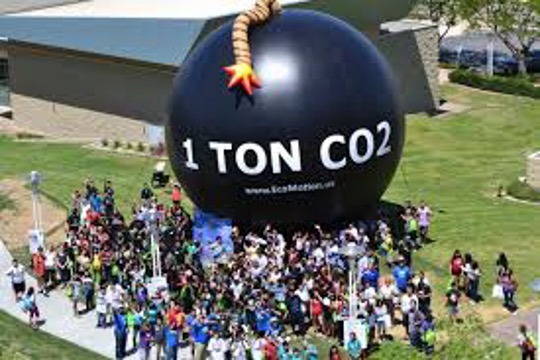
A new study shows $185 per ton of CO2 is the Social Cost of Carbon (SCC)
Now we can start looking at how these mealtime favourites get to the customer: via the last mile.
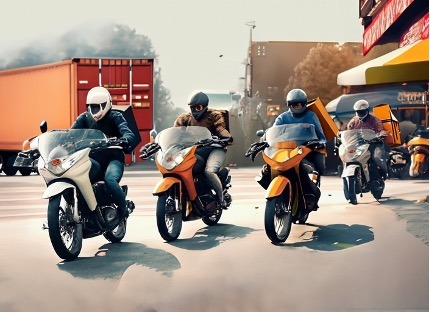
There are currently 92,000 petrol delivery bikes in Dubai, with an estimated 142,000 in the UAE, but how polluting are these two wheeled delivery vehicles to the environment, a little traverse to a fact if I may:
Warning: I’m going to get my ‘geek on’ with the true cost of your delivered pizza: A Journey Through Dough, Dollars, and Diesel
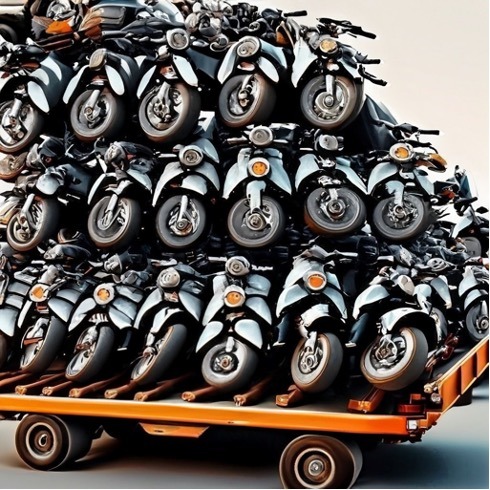
1,000 to 1:
Comparing the environmental impact of just 1,000 petrol delivery motorcycles to 1 delivery van involves considering several factors, including fuel consumption, emissions, maintenance, manufacturing, and end-of-life impacts. Here’s a general analysis based on typical data and assumptions, using the above 1,000 pizza calculations from earlier:
Fuel Consumption and Emissions:
Petrol Motorcycles (1,000):
Fuel Consumption: Petrol motorcycles generally have a higher fuel consumption rate per mile compared to vans.
Emissions: Given the number of motorcycles, the total emissions from 1,000 petrol motorcycles, including carbon dioxide (CO2), nitrogen oxides (NOx), and particulate matter (PM), is significant.
Delivery Van (1):
Fuel Consumption: Vans have a more fuel-efficient engine and can carry a larger load per trip, resulting in lower fuel consumption per pizza delivered.
Emissions: The emissions per pizza delivered would be lower due to the efficiency and capacity advantage of vans.
Maintenance and Manufacturing:
Petrol Motorcycles (1,000):
Maintenance: The maintenance costs and environmental impact associated with maintaining 1,000 motorcycles is higher compared to maintaining a single van.
Manufacturing: The manufacturing process of 1,000 motorcycles would result in a significant environmental impact, including resource consumption and emissions.
Delivery Van (1):
Maintenance: Maintaining a single van would be more efficient and result in lower overall maintenance-related environmental impact.
Manufacturing: Although the manufacturing impact of a van is higher than a single motorcycle, it’s spread across fewer units, making the per unit impact lower.
Packaging and Waste:
Petrol Motorcycles (1,000):
Packaging waste, although generally small for motorcycles, would be multiplied by 1,000, resulting in a significant cumulative waste impact.
Delivery Van (1):
Packaging waste from a van would be comparatively less, as it can accommodate larger and more secure packaging.
Total Environmental Impact:
Considering the factors mentioned above, the total environmental impact of 1,000 petrol delivery motorcycles is likely to be higher compared to a single delivery van. The key factors contributing to this difference are the higher fuel consumption per vehicle, cumulative emissions, maintenance requirements, manufacturing impact, and waste generated.
Calculated delivery truck payload is 5 tonnes, and they emit around 700g Co2e/mile.
Petrol bikes are at around .25g Co2e/mile.
If the bikes carry 1kg on average, then they emit 0.25kg Co2e, per mile, per kg.
If your truck carries 5 tonnes, we’re emitting 0.14g Co2e, per mile, per kg.
Forgetting the numbers, if we just look at weight and payload, it seems like a 5 tonne truck is the equivalent of 5,000 bikes zipping 1kg each that last mile.
So although a single van is clearly more ‘environmentally friendly’ to delivery 1,000 pizzas, it isn’t in the customer’s interest of convenience – motorcycles it is then.
Did You Know?
Petrol motorcycles in their first year of life are 16x more harmful to the environment than SUVs or busses, in their second year and beyond, this increases to 50x!
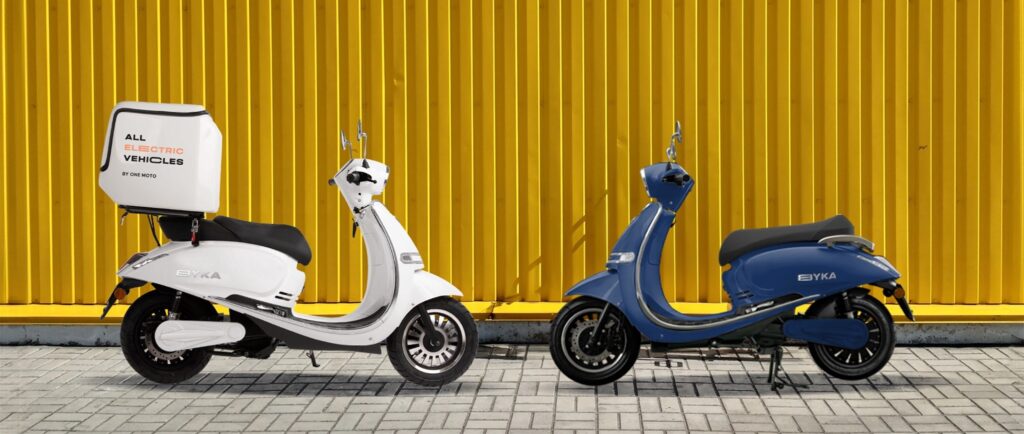
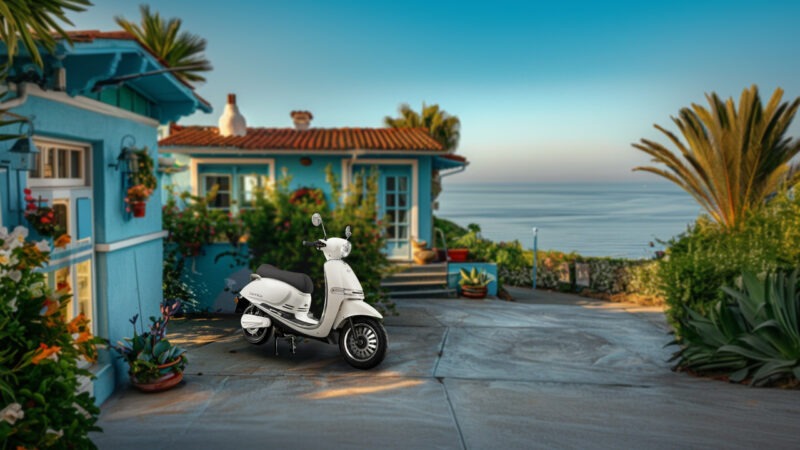
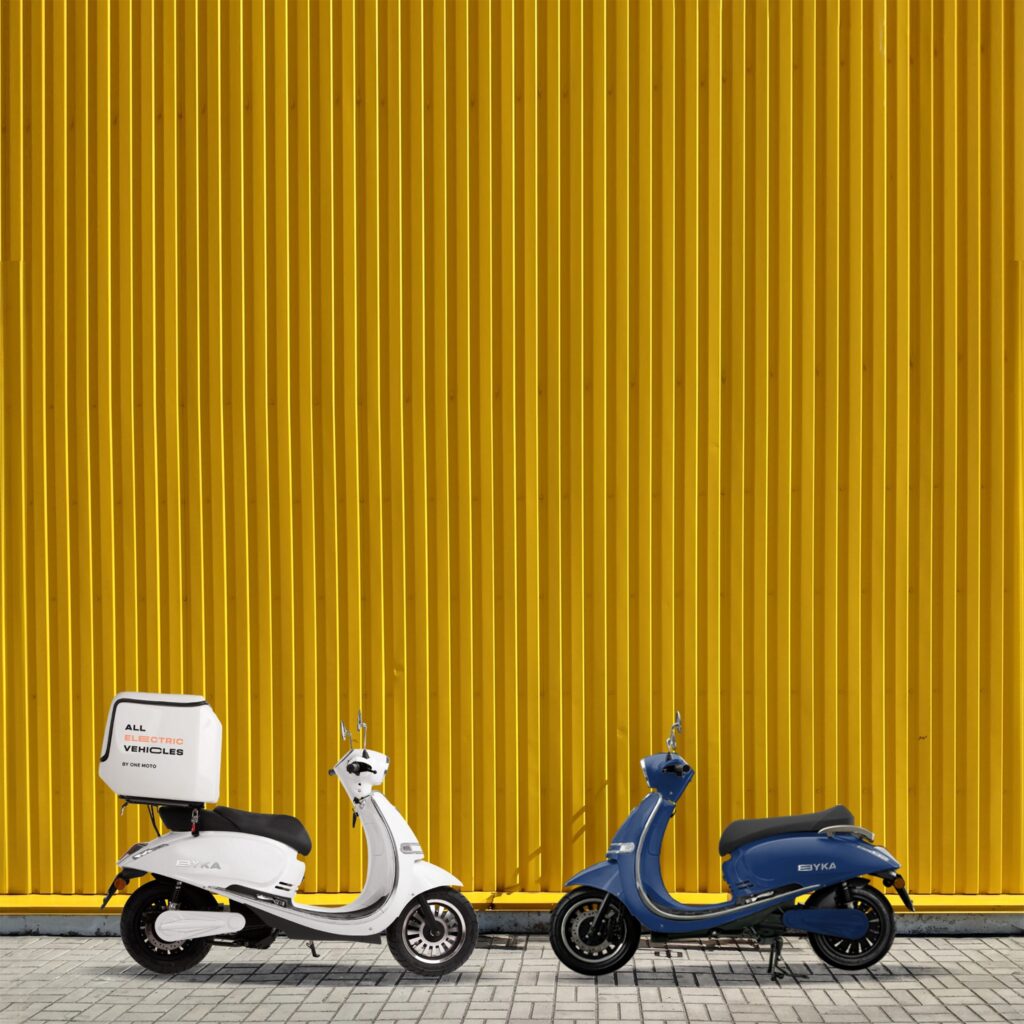
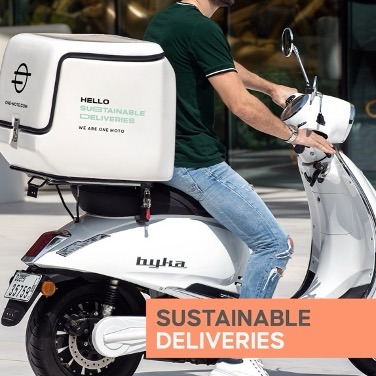
ONE MOTO have dedicated their cause to make a difference, by offering the very best in class electric vehicles for sustainable delivery.
There is a sustainable solution, one which does come with questions; “Are electric delivery motorcycles better?” The short answer is yes they are, however, let me frame the reasons:
Cost: Operating an EV from ONE MOTO is cheaper than it’s petrol counterpart.
Considering ONE MOTO vehicles; the delivery rider faces no fuel costs (currently between AED 600 and AED 800 per month) around 29% of their gross annual salary.
Servicing and maintenance, this is minimal and equivalent to AED 2 per day.
Profitability: 3rd Party logistics or 3PLs who supply the vehicle and riders to the delivery platforms work on very thin margins, forcing them to cut costs wherever they can, which is either by ‘unjustified’ deductions from the riders, reduced maintenance, servicing, tyre changes.
As EVs have less moving parts the inventory dealers need to carry and the cost is reduced significantly.
Environmentally: Each petrol motorcycle produces around 4.2 tonnes of CO2 each year, which when multiplied, emits a chocking 260,000 tonnes of CO2, which if we had the forest to sequester this would be equivalent to over 290,000 acres of forest (that’s 10x the size of Paris), although 92,000 is a lot for our city, comparing this to other markets like Vietnam (67 million petrol motorcycles), India (37 million), Pakistan (20 million), UK (1.3 million), Africa (27 million) the numbers, harm and lack of awareness are quite toxic to each and every one of us.
Why are more customers not demanding a sustainable delivery option? They may not know one is available, this is our challenge. We conducted a survey recently which demonstrated consumers of the UAE would be prepared to pay up to AED 6.7 more for sustainable delivery than from a company who doesn’t offer such a ‘radical’ solution. Moreover, residents receive deliveries (on average) of five per week from groceries, food, meal plans and e-commerce purchases.
Then we can really claim change is being actioned.
Where are the champions, my friend?
Over recent months the team and I are receiving far greater inbound enquiries to our solution, which leads to internal champions of organisations wanting to be active in their ‘Green Agendas’ and leading by example. Achieving the upper hand against competition and the data and commercials stack up, even without the environmental consideration. “If the commercials make sense we’ll commit” we hear this often and with the data and reputation we’ve garnered, this change is coming.
What’s the big idea?
This comes from our initial vision and very firm agenda “to decarbonise last mile delivery in the UAE”. Having successfully secured $40m of financing (for the UAE), we are wanting to help support our customers transition and demonstrate the UAE could offer a global first of a sustainable last mile delivery network, but this bodes a question, “will companies commit if the government doesn’t lead by example or mandate such a motion toward?” This has been discussed and currently being considered by the country’s leaders.
This article ”The true cost of your delivered pizza” isn’t to deter you away from pizzas, set guilt within your palate it’s to consider and demonstrate how something we take for granted “the delivery of everything” can be so harmful, costly (beyond the order value) and to highlight there is a better solution for each stakeholder in the supply and value chain.
If you would like to be offered sustainable deliveries by your preferred delivery platform please post in the comments below.
ONE MOTO have dedicated their cause to make a difference and built the company on core values that matter, by offering the very best in class electric vehicles for sustainable delivery.
Have a click through and discover the fleet, leasing, telemetry, after-sales, distribution solutions for you personally and your company.
Thank you for reading,